Research Charette
Background
The Information Deficit is one of the top five unmet needs facing people affected by cancer in Ireland today. This four day research charette / design sprint aimed to explore gaps in information for people affected by Breast Cancer. The insights gained from this week long study formed the basis of my masters research proposal.
Charette Overview
Over the four days we investigated how people find information on their disease. The team identified gaps in the usability of Irish and international websites, the quality of information they found, and explored communication pathways and signposting.
Online Research
Context
You have been diagnosed with one of the four following Breast Cancer sub-types:
- Triple Negative Breast Cancer
- Metastatic Disease
- Invasive Lobular Carcinoma
- BRCA mutation
Brief
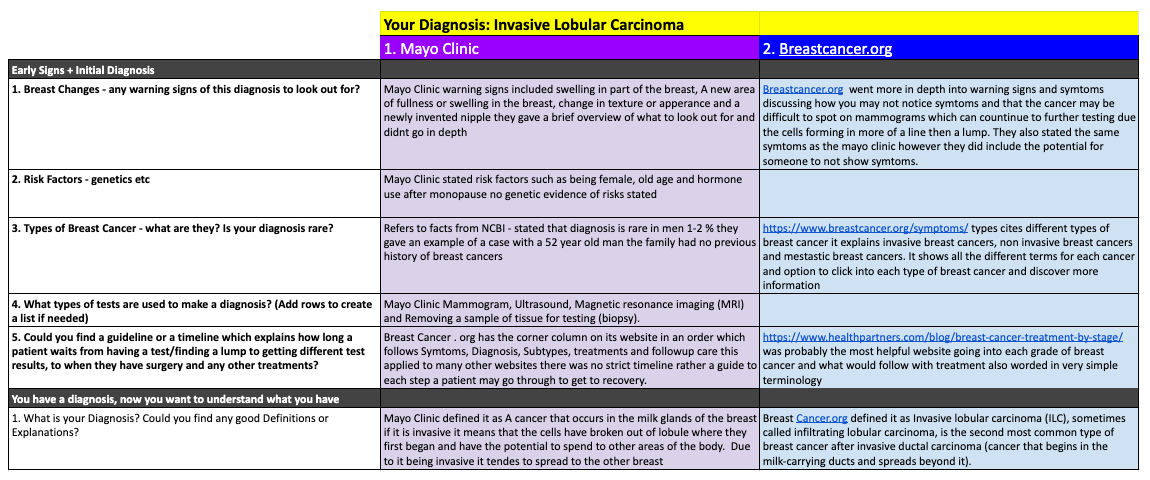
Search online using websites see what information you can find about your diagnosis, prognosis and treatment.
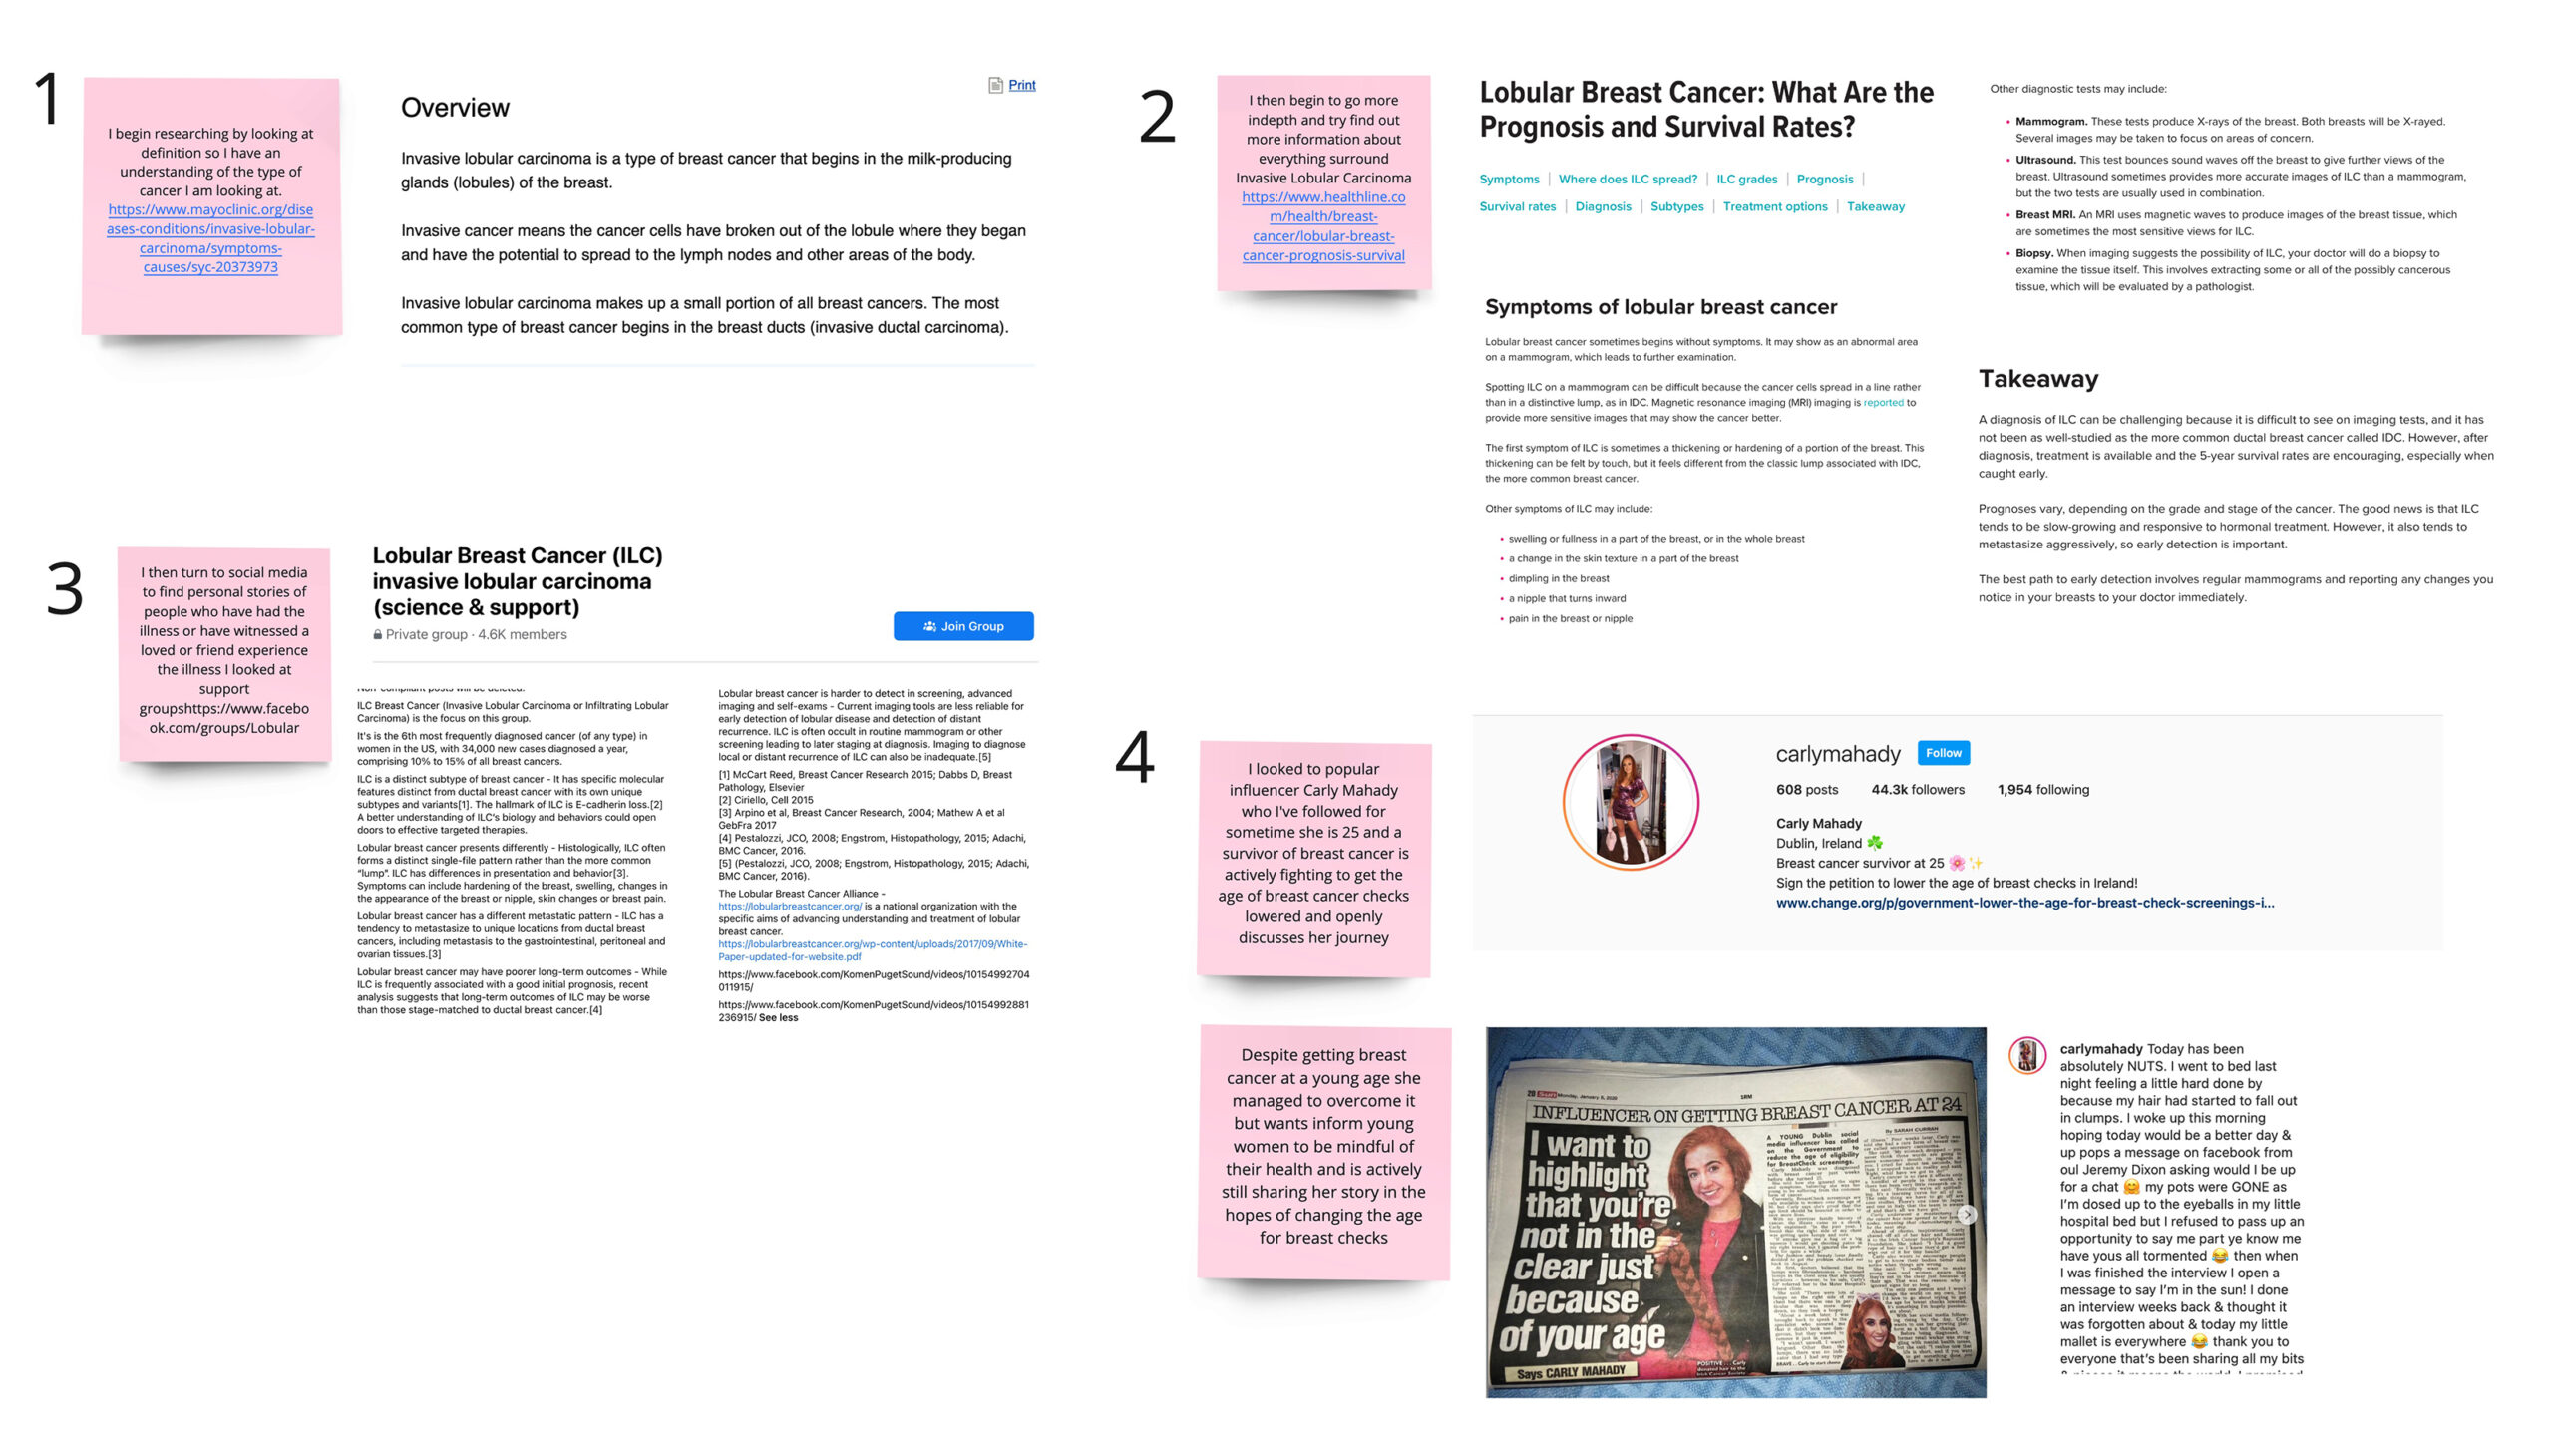
I wanted the participants to have something to work with so I provided a spreadsheet of questions a patient might ask. I deliberately did not tell the them what websites to look at. I wanted to see where they would end up. Like a newly diagnosed patient they would have to navigate the range of information available online to understand their diagnosis.
Online Research: Findings
Observations
Based on their research participants reflected and made observations.
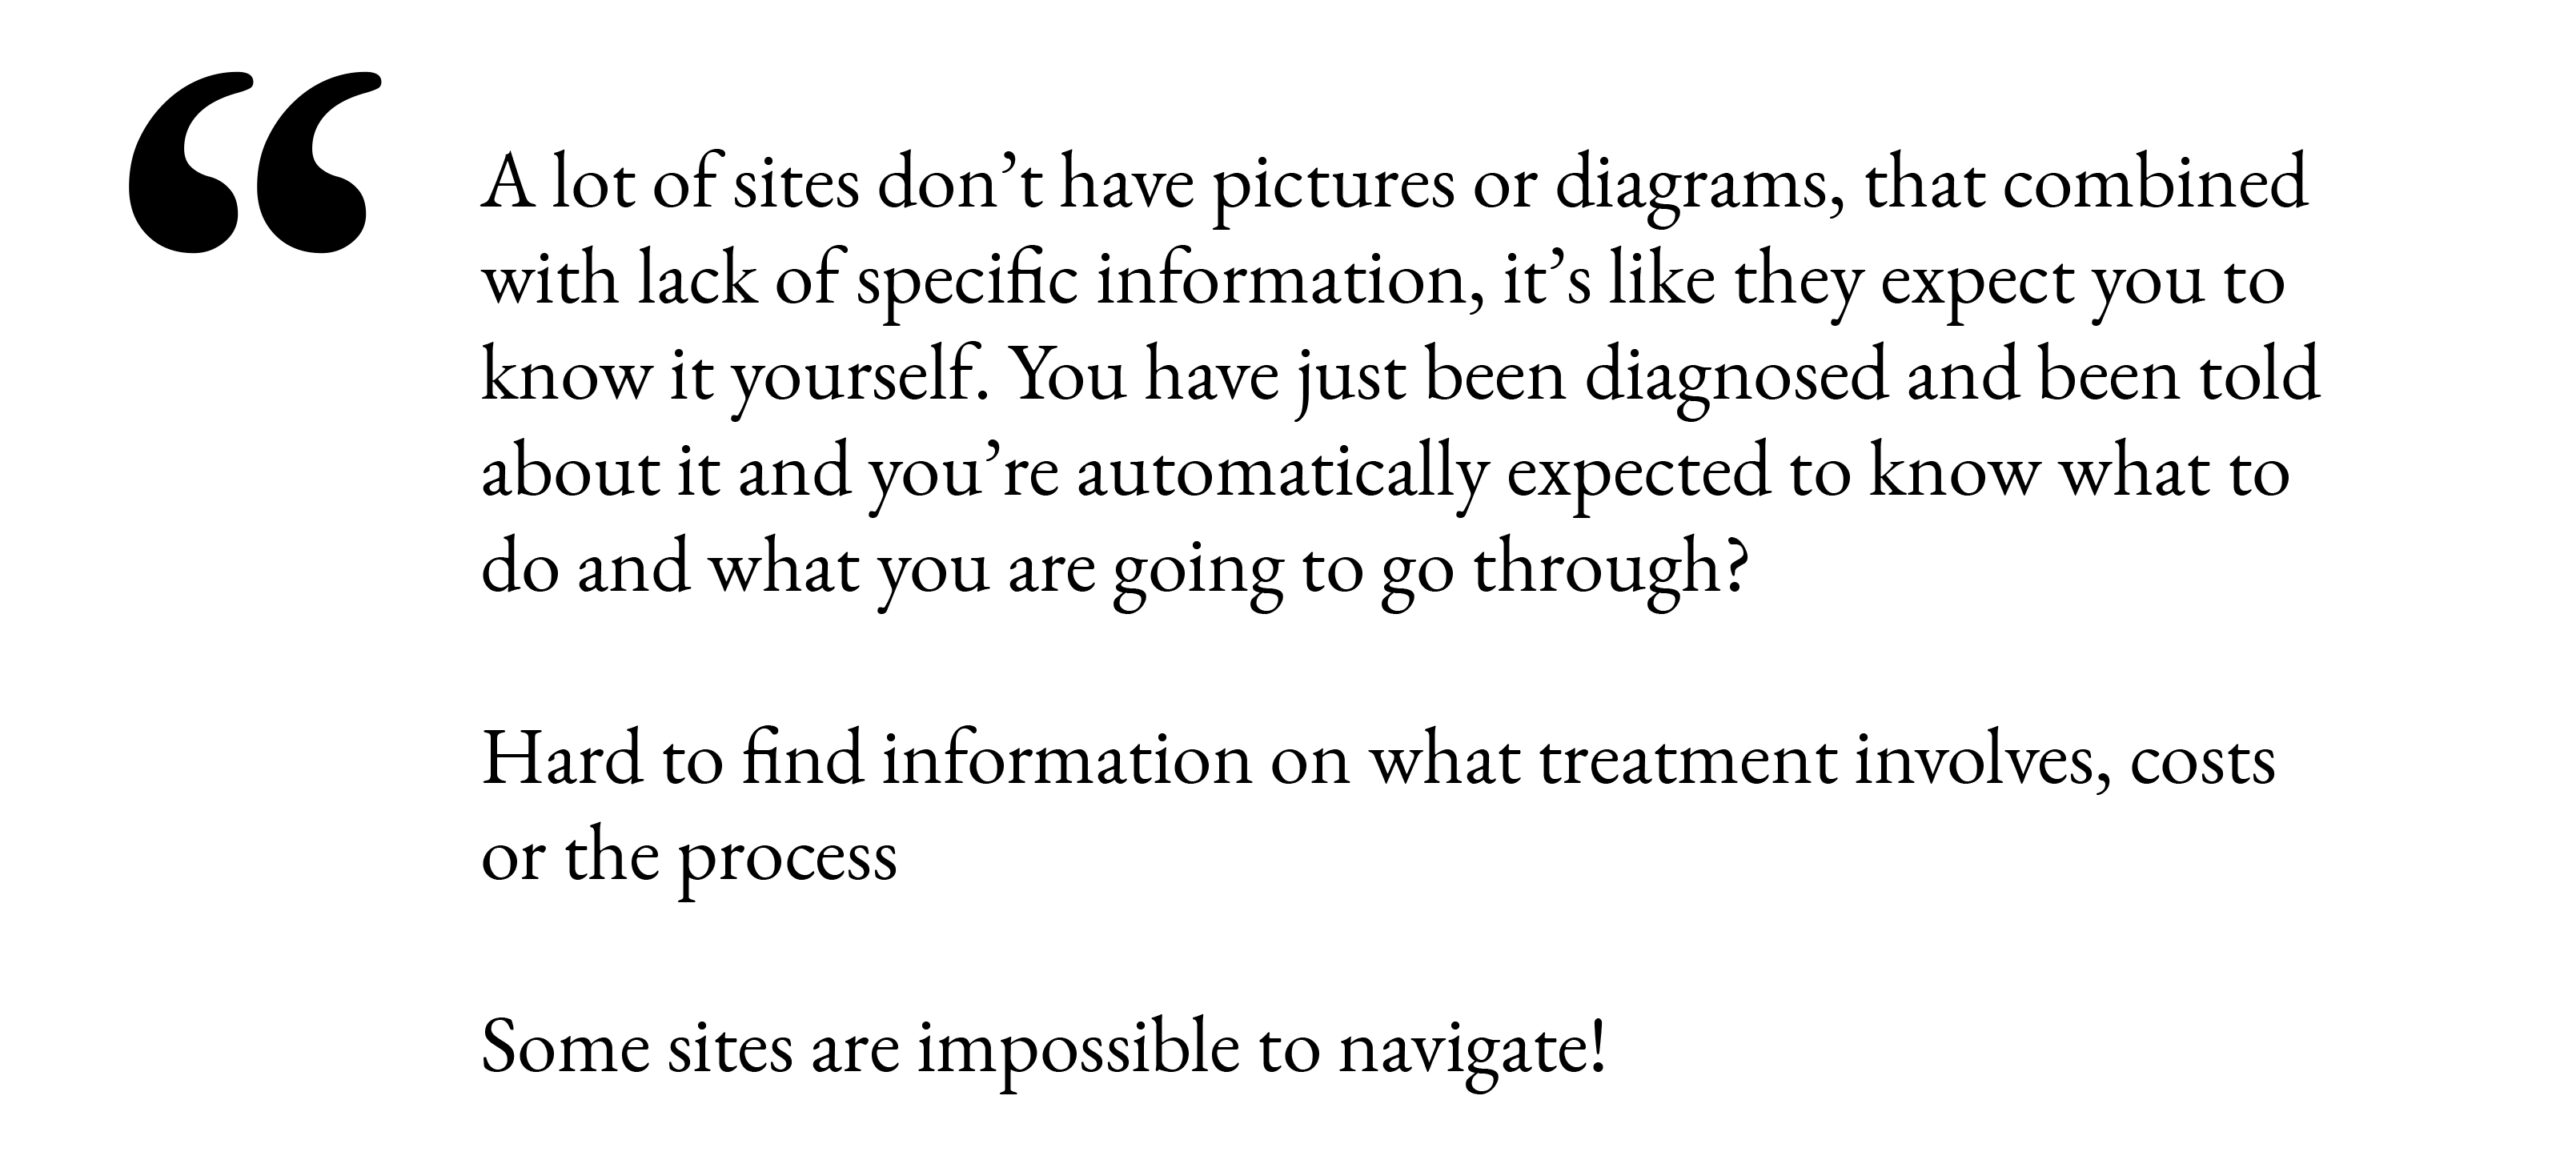
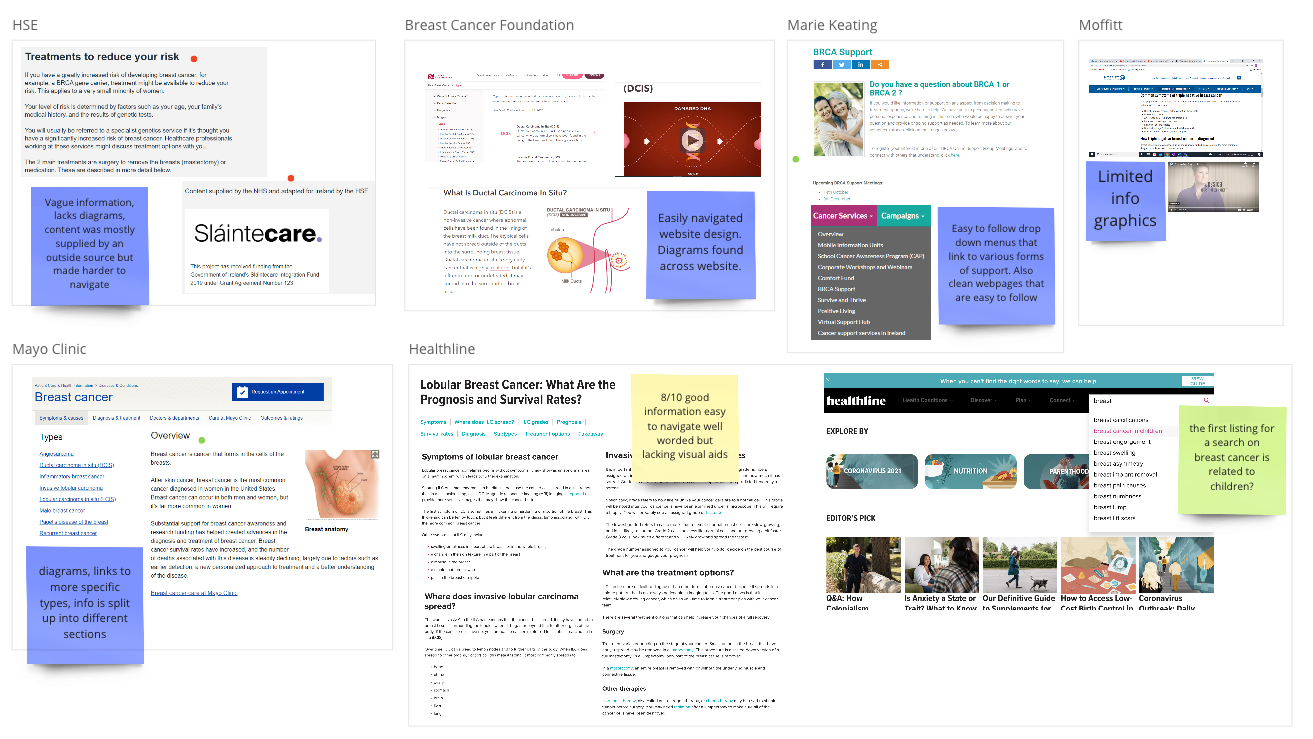
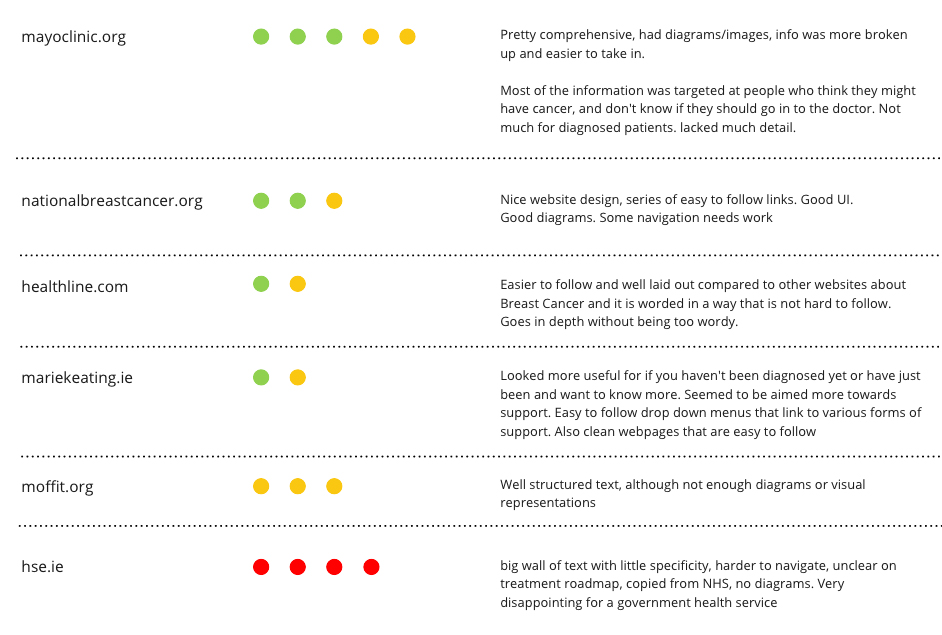
The overall observation was that the websites did not provide the participants with the information they were looking for. Given that they had specific diagnosis to work with they found that most of the sites gave vague overviews. The level of content varied greatly, it was either surface information or dense and hard to digest. This was combined with poor navigation.

Usability Analysis
The participants reflected on how easy it was to use the websites, took visuals as reference and made comments. They then ranked the websites using a traffic light system - Good (Green) / Yellow (Average) / Poor (Red). The answers were combined to give an overview of the results.
Insights
- Lack of specific information
- Lack of images and diagrams
- Lack of after-care information
- Hard to find information on what treatment involves, costs or the process
- General timelines would be nice so that patients can go in with some basic expectations
- It’s either top surface information v's dense and hard to digest
- Not enough guidance on emotional support
- Most sites didn’t have much on how your experience might differ with age
- Most information could be more easily found on international sites.
Information Seeking Behaviours
Brief
To understand information seeking behaviours I gave the participants the following brief:
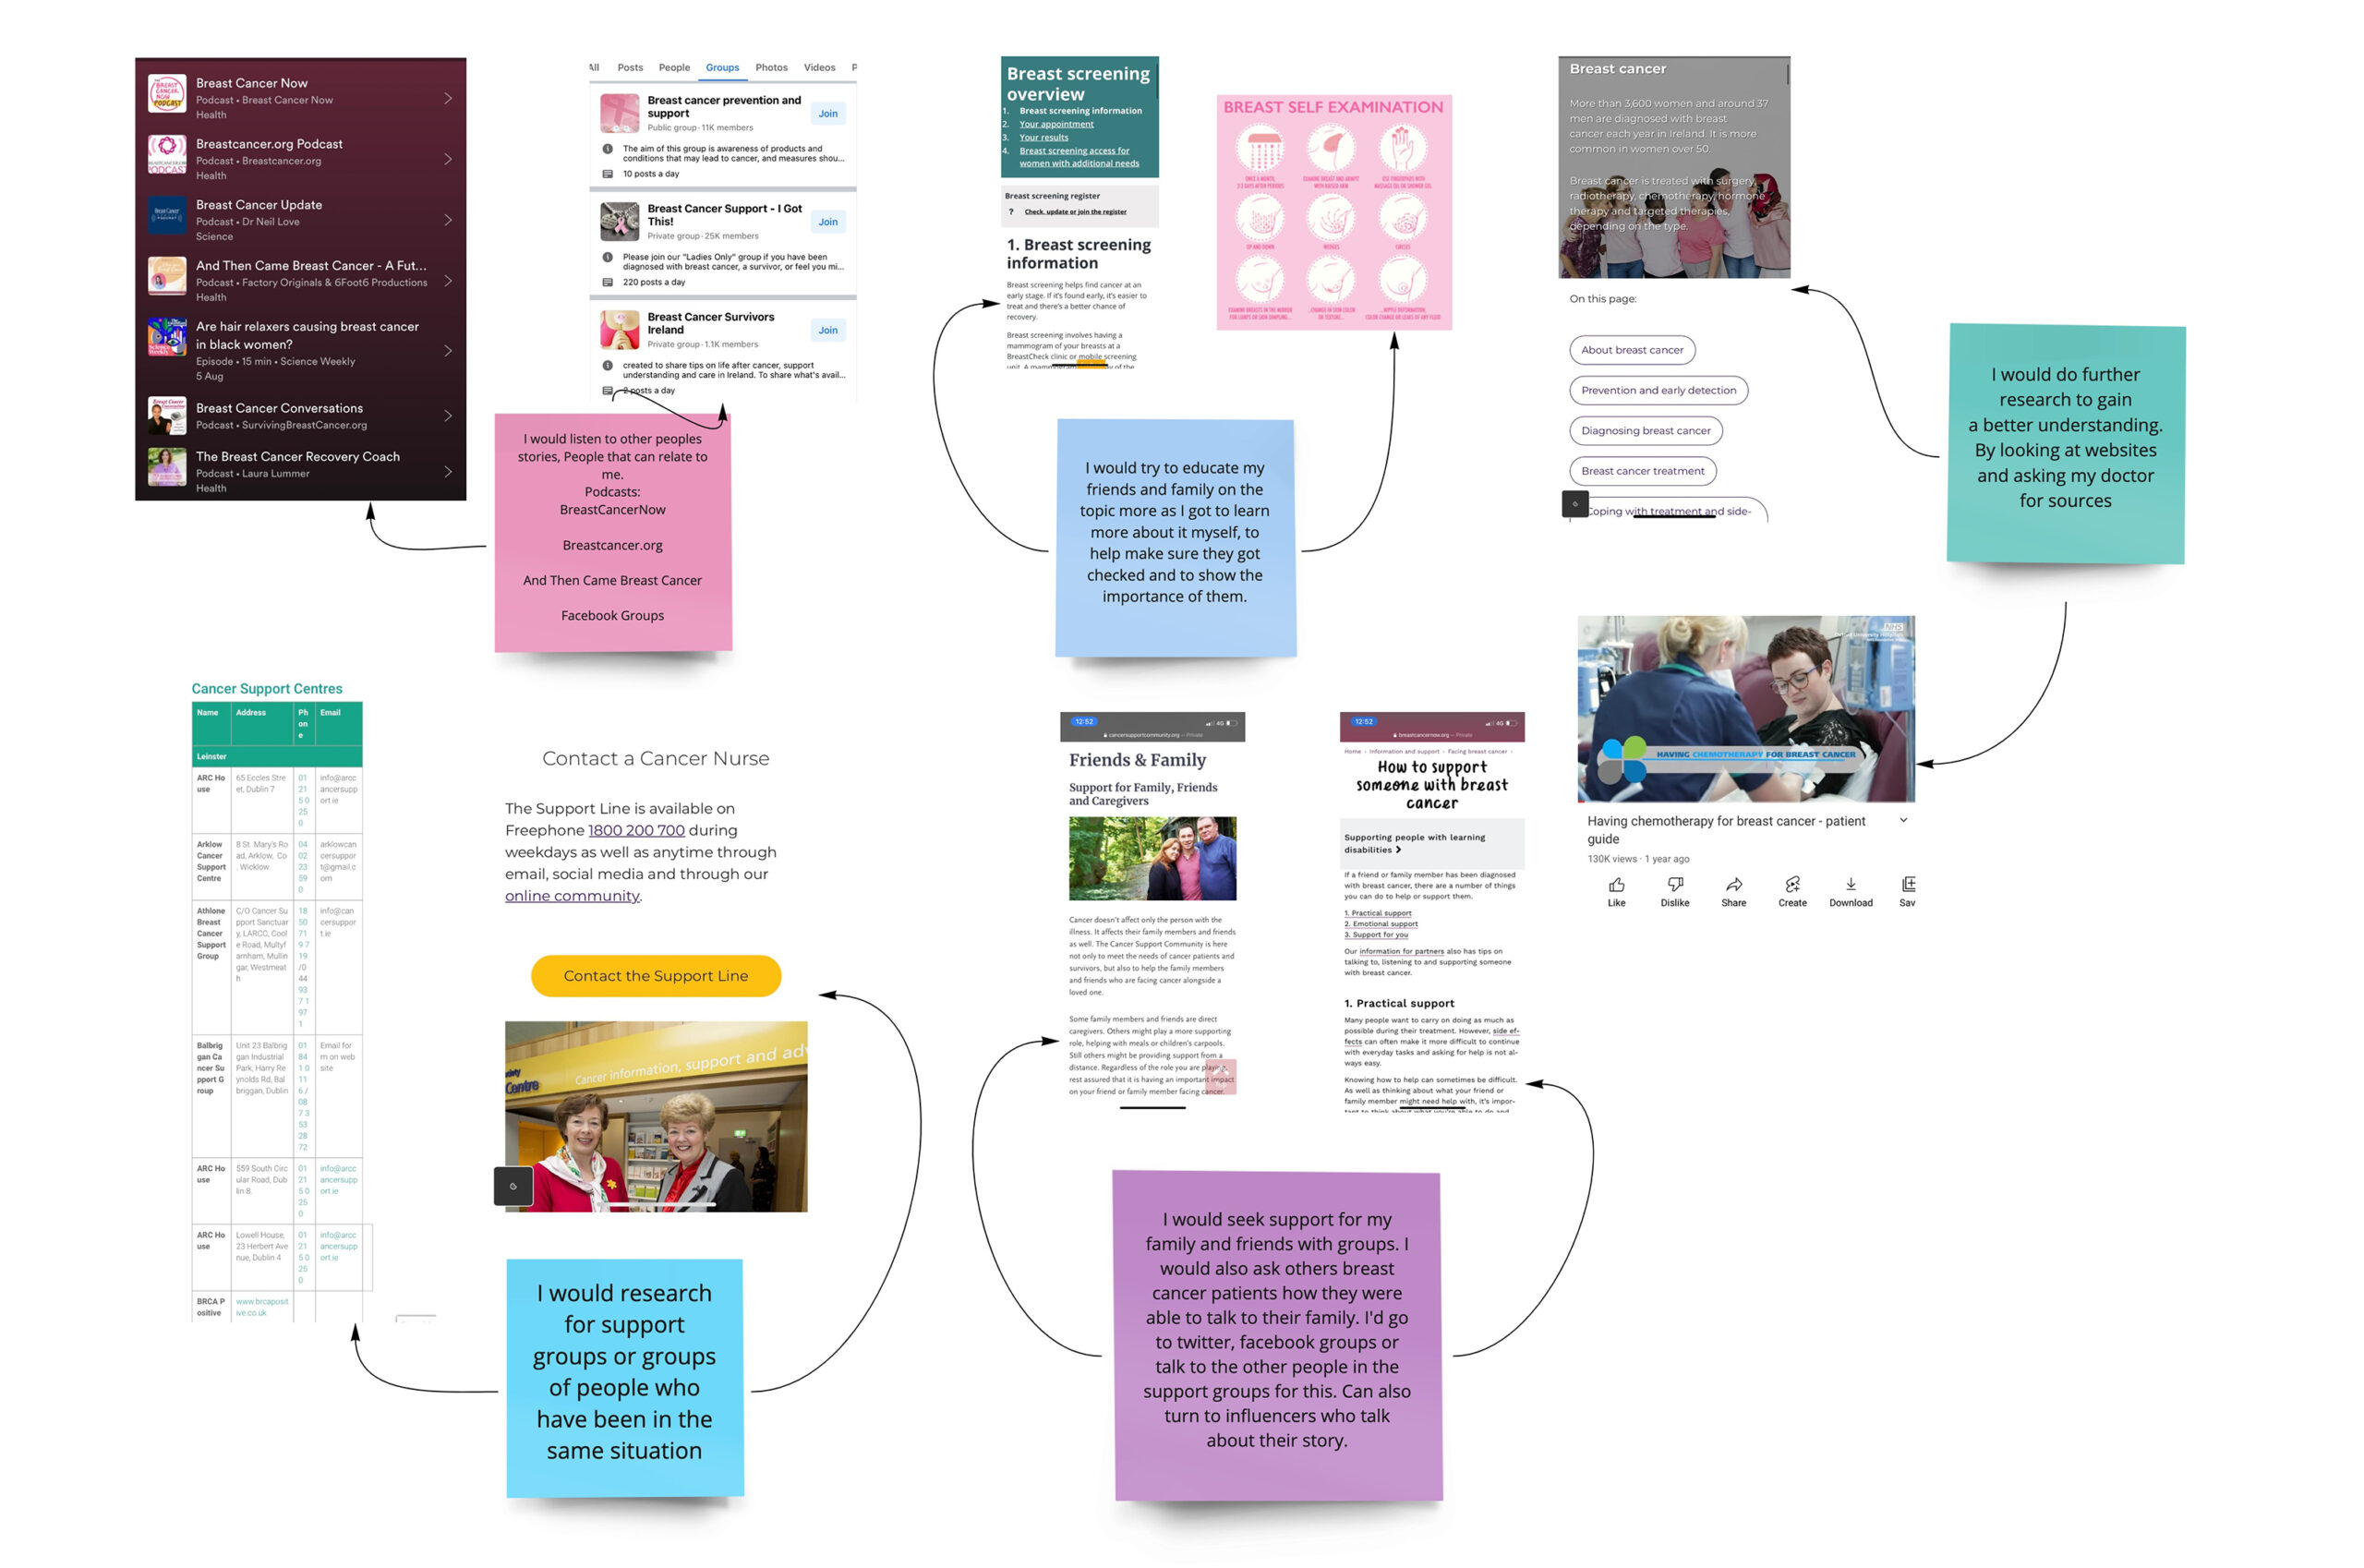
Create boards, collect visuals and explain your choices based on the following questions:
- How would you search for information on a specific topic?
- What sources would you use?
- How would you rate the information you find?
Rationale
Given that the participants were students their habits would reflect a younger demographic. Cancer service providers target older age brackets, therefore they may be limiting their reach by missing potential communication opportunities through new technology and social media channels. This task provided insights into a variety of information gathering techniques by different types of users.
Insights
Offline Information Sources
- People
Family / Friends / GP
Support Groups - Books/Booklets
Cancer Charity booklets
Published books on topic
Online Information Sources
- Charity Websites
- Google - Go searching see what pops up
- Look for Online Community Support Groups
- Social Media - Would use Instagram, Facebook, Twitter to find support + follow influencers
- Podcasts - listen to people stories
- You Tube - try to find explanatory and informative videos
- Reddit - it’s anecdotal but moderated, so you can ask and people may provide support and information on where to go
Information Gaps
Using Design Thinking Tools we completed the following steps.
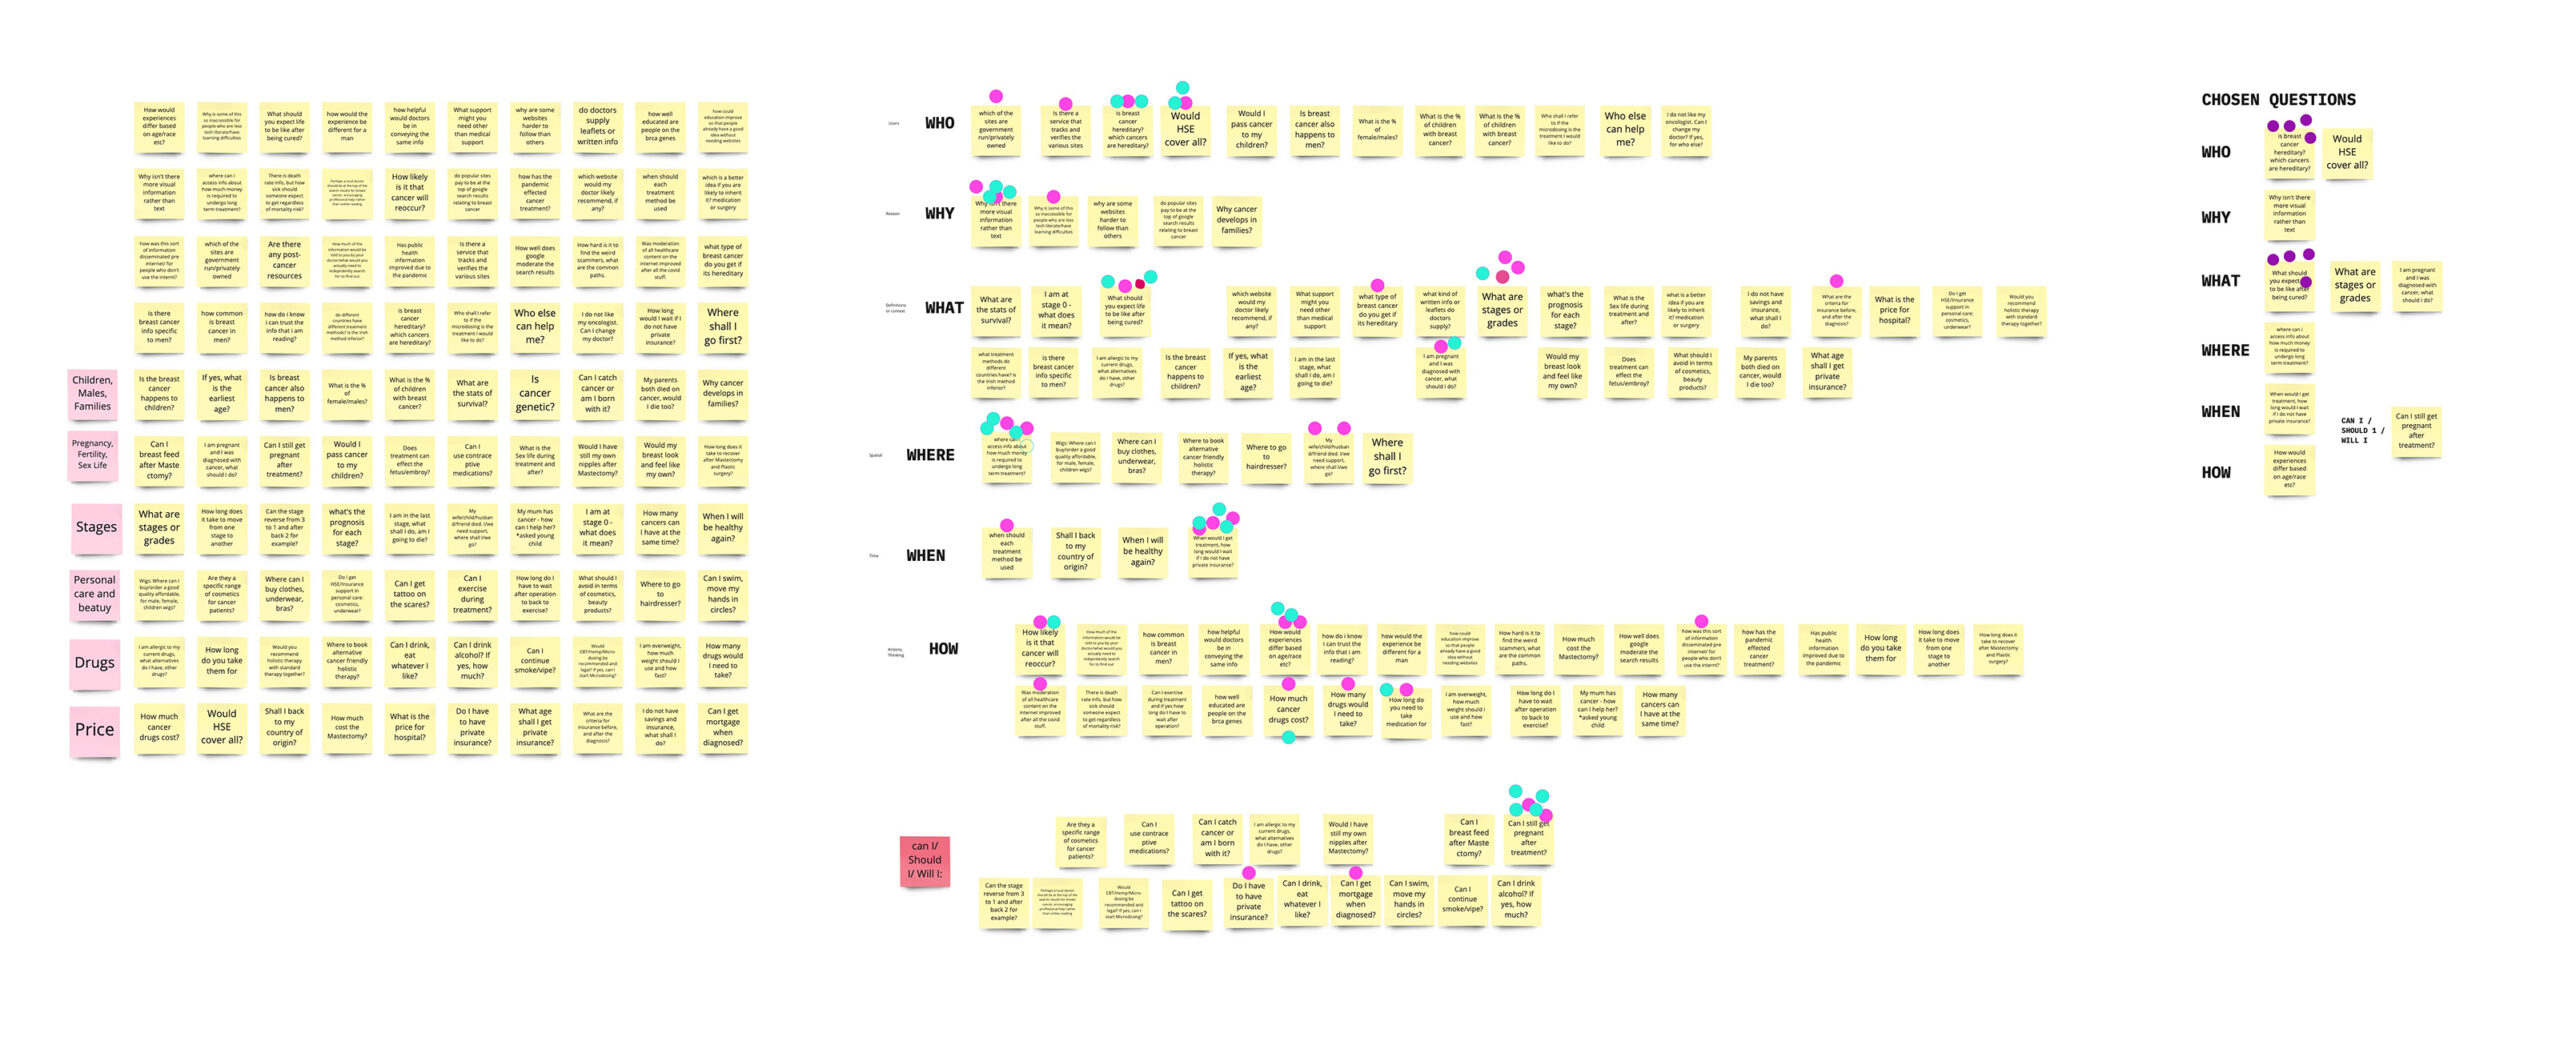
Step 1: What questions do you have?
Based on what you researched and observed what do you have questions about? Fill out as many post-it notes as you can.
1) Compile 100 Questions.
2) Sort the questions into 5W’s + H.
3) Vote on the questions matter most to you
Step 2: Do we have an answer?
Based on what you have learned so far could you could answer these questions?
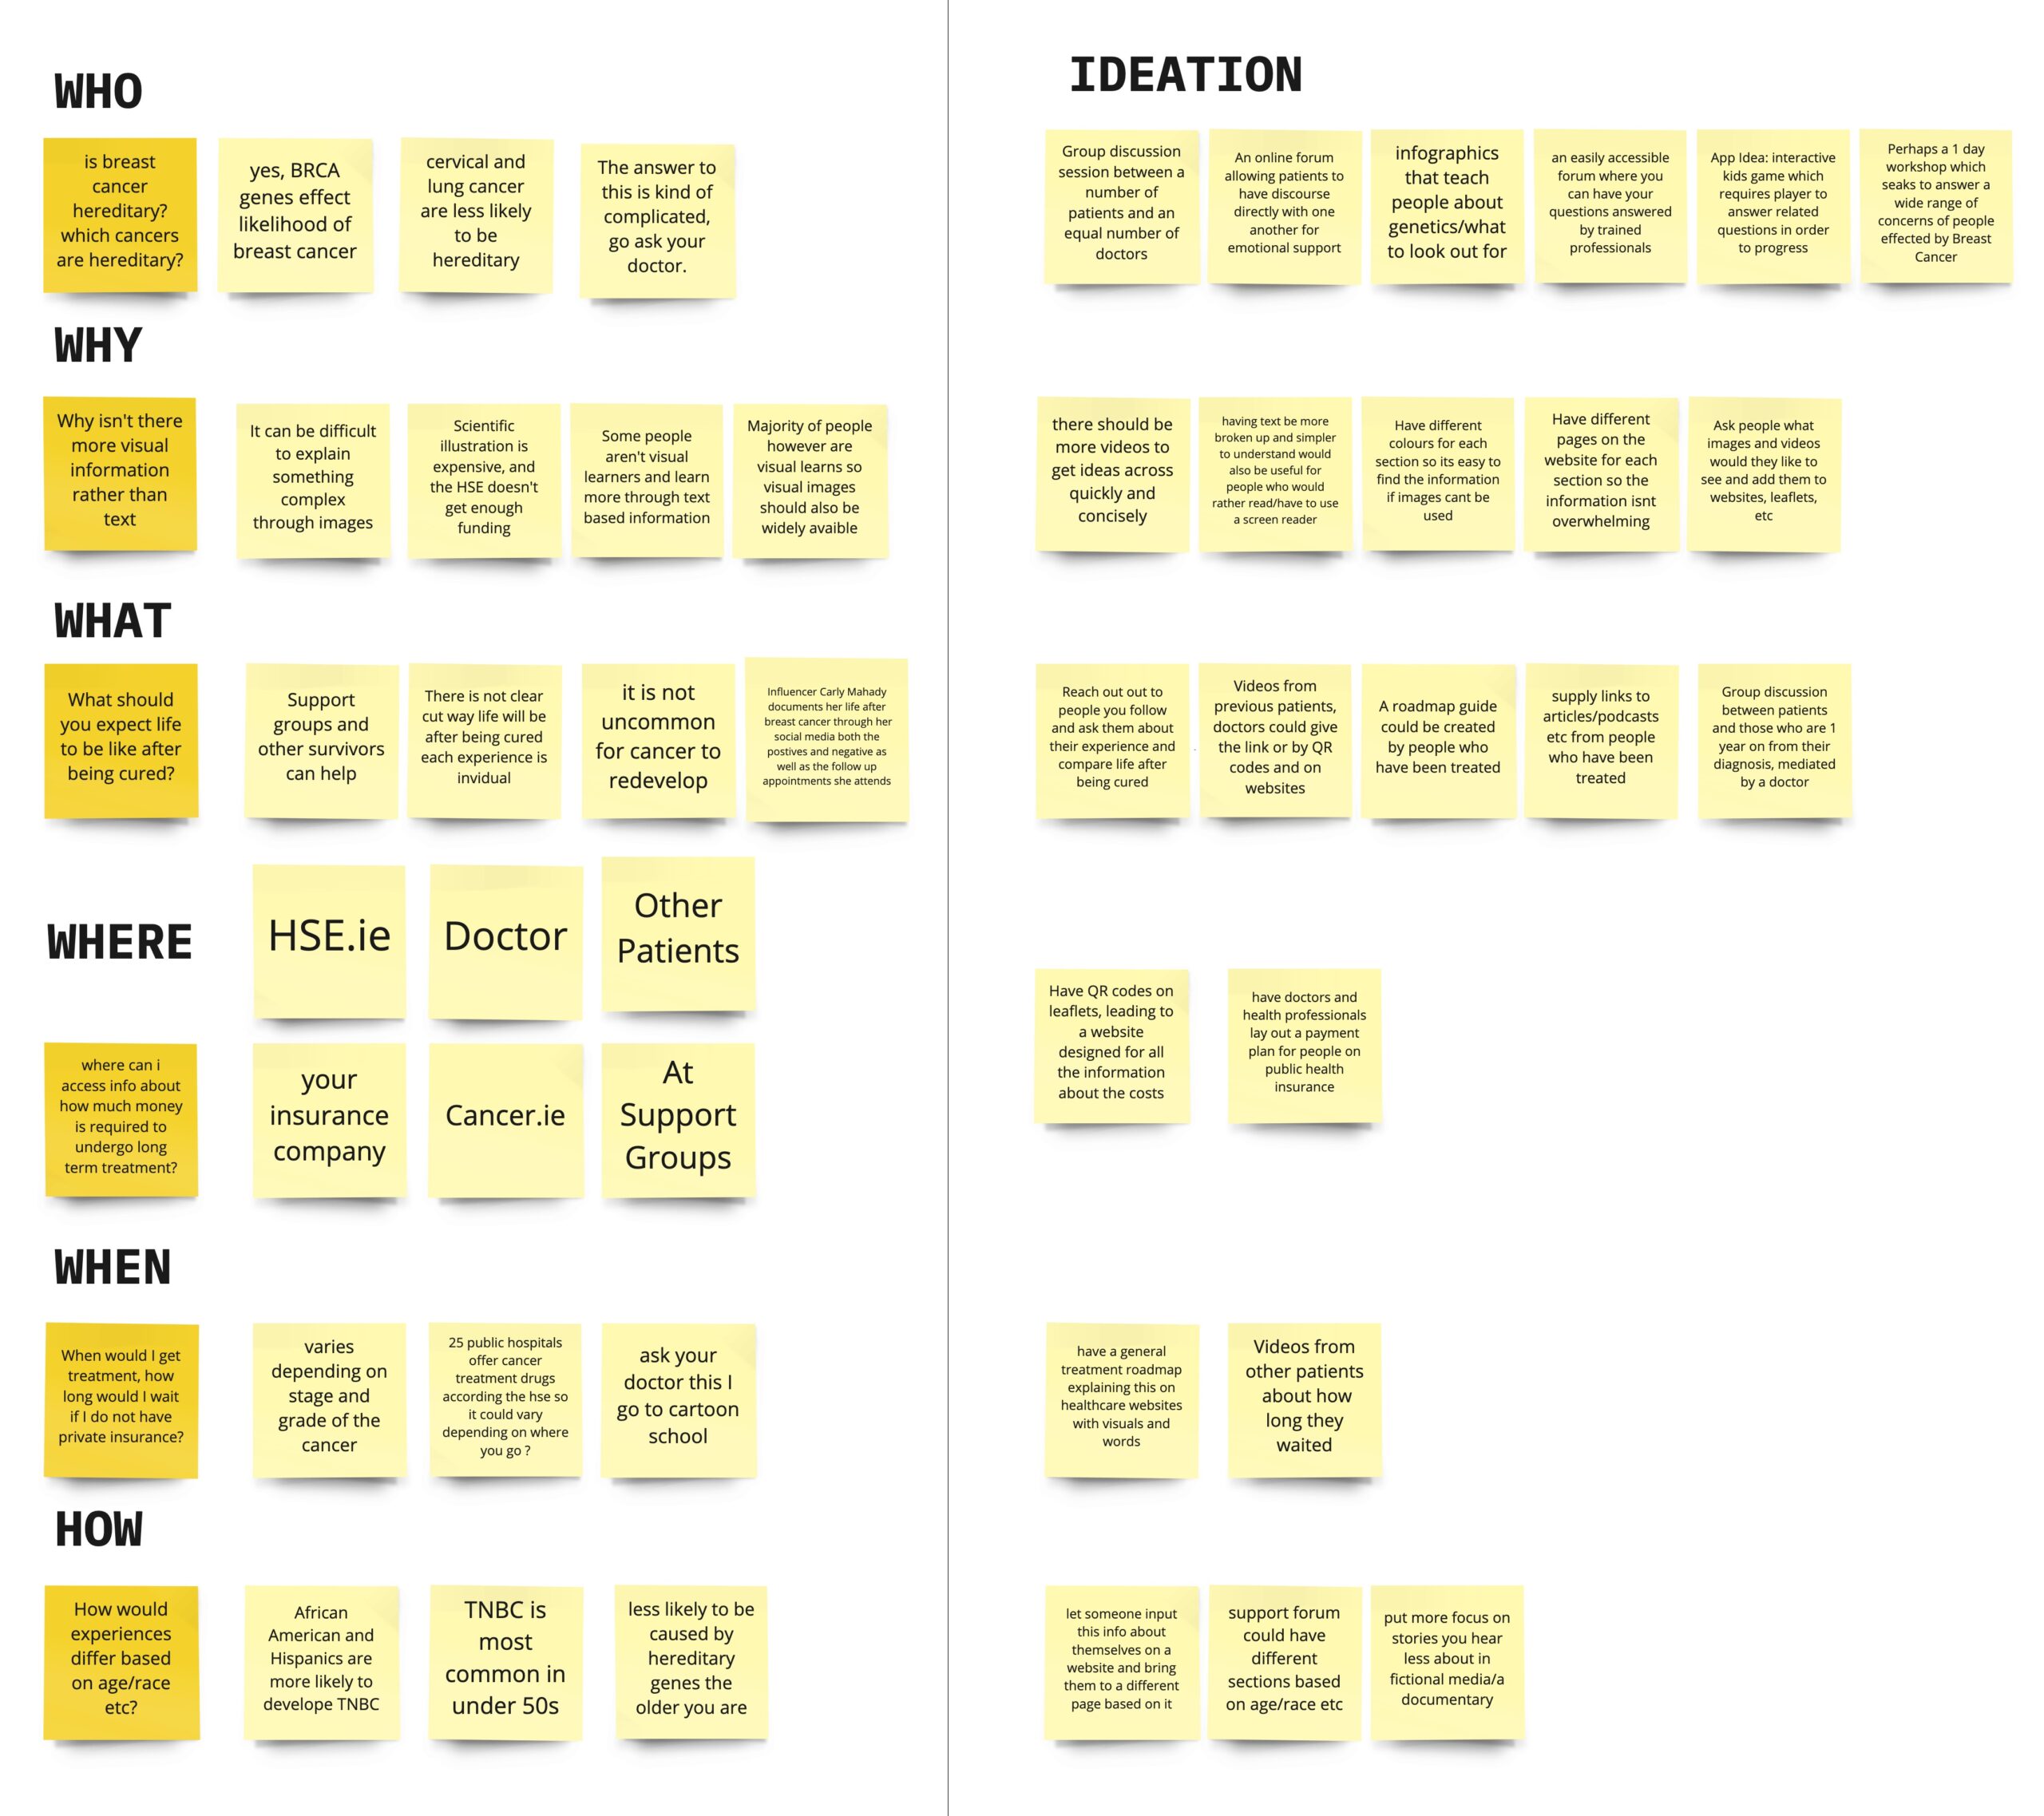
Step 3: Ideation
What ideas do you have that might help solve the questions you have asked?
Mapping Exercises
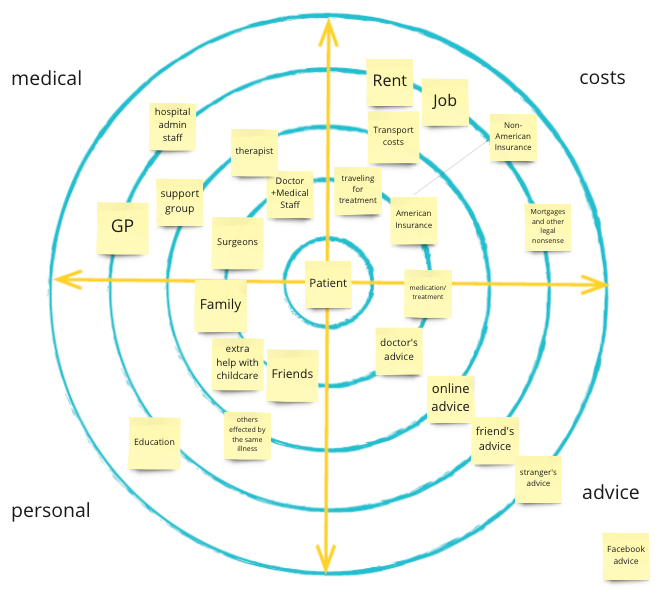
Stakeholder Map
The group mapped out the key people in the Breast Cancer trajectory and arranged them according to priority. This stakeholder map produced provided a very general overview.
This stakeholder map reflects a public lack of awareness around the number of people involved in a patients care. Further research I have conducted shows the polarities between patient v's health professionals knowledge of the breast cancer medical team.
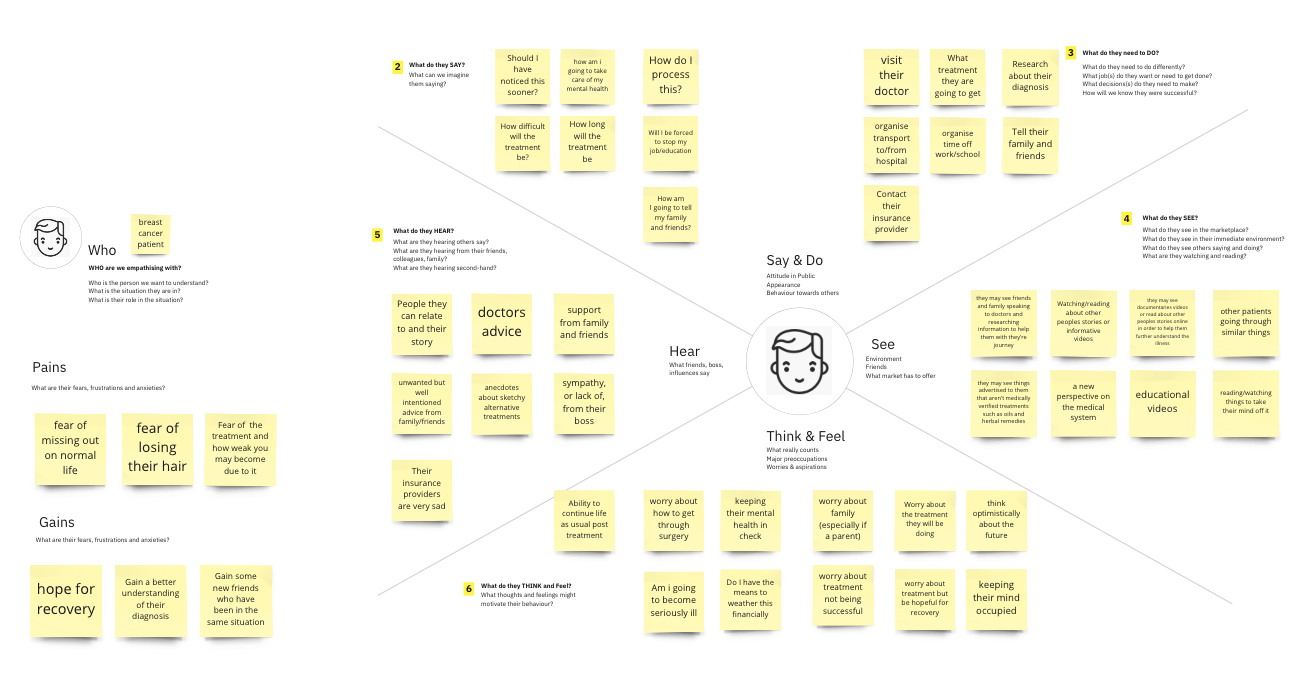
Empathy Map
This tool enabled the team to build and express their empathy for the end user. It also allowed them to review their bias.
Afterwards I thought it would be interesting to perform this task at the start of a workshop and then at the end, the comparison could show initial assumptions and how they changed based on the development of participant knowledge.
Communication Pathways
How do we communicate?
To understand how to communicate we looked at how people learn and absorb information.
- Visual learners – absorb information by sight
- Auditory learners – absorb information by sound
- Kinaesthetic learners – absorb information by moving
How can media communicate to all types of learners?
We researched types of media, how media is classified and the different channels a service would use to communicate to its audience.
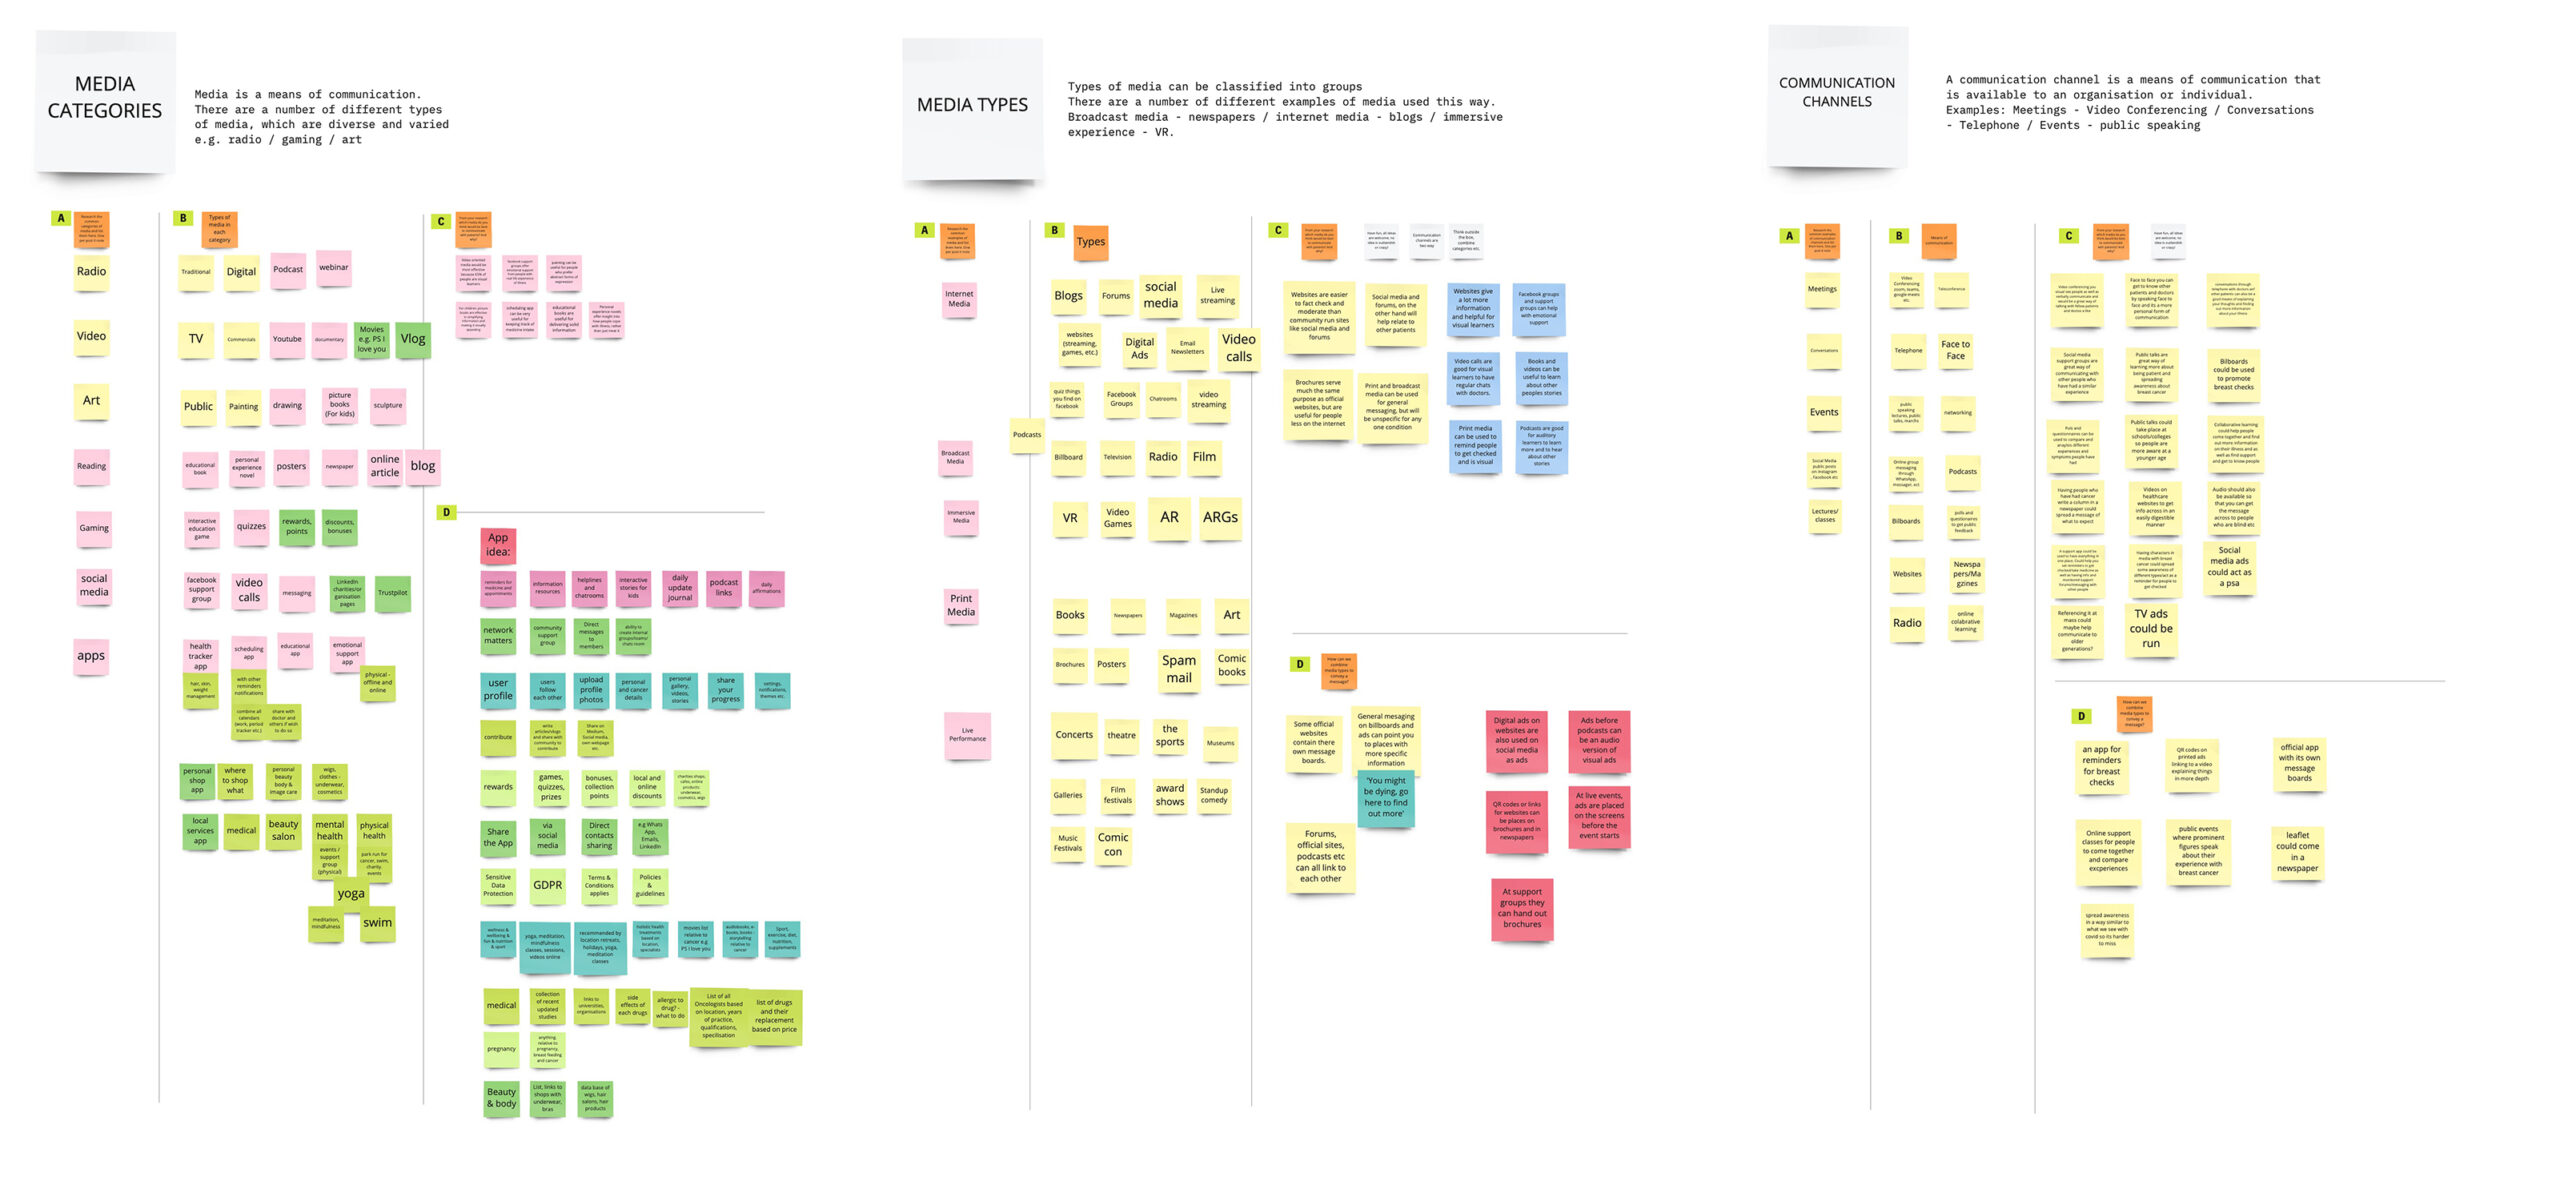
Affinity Diagram
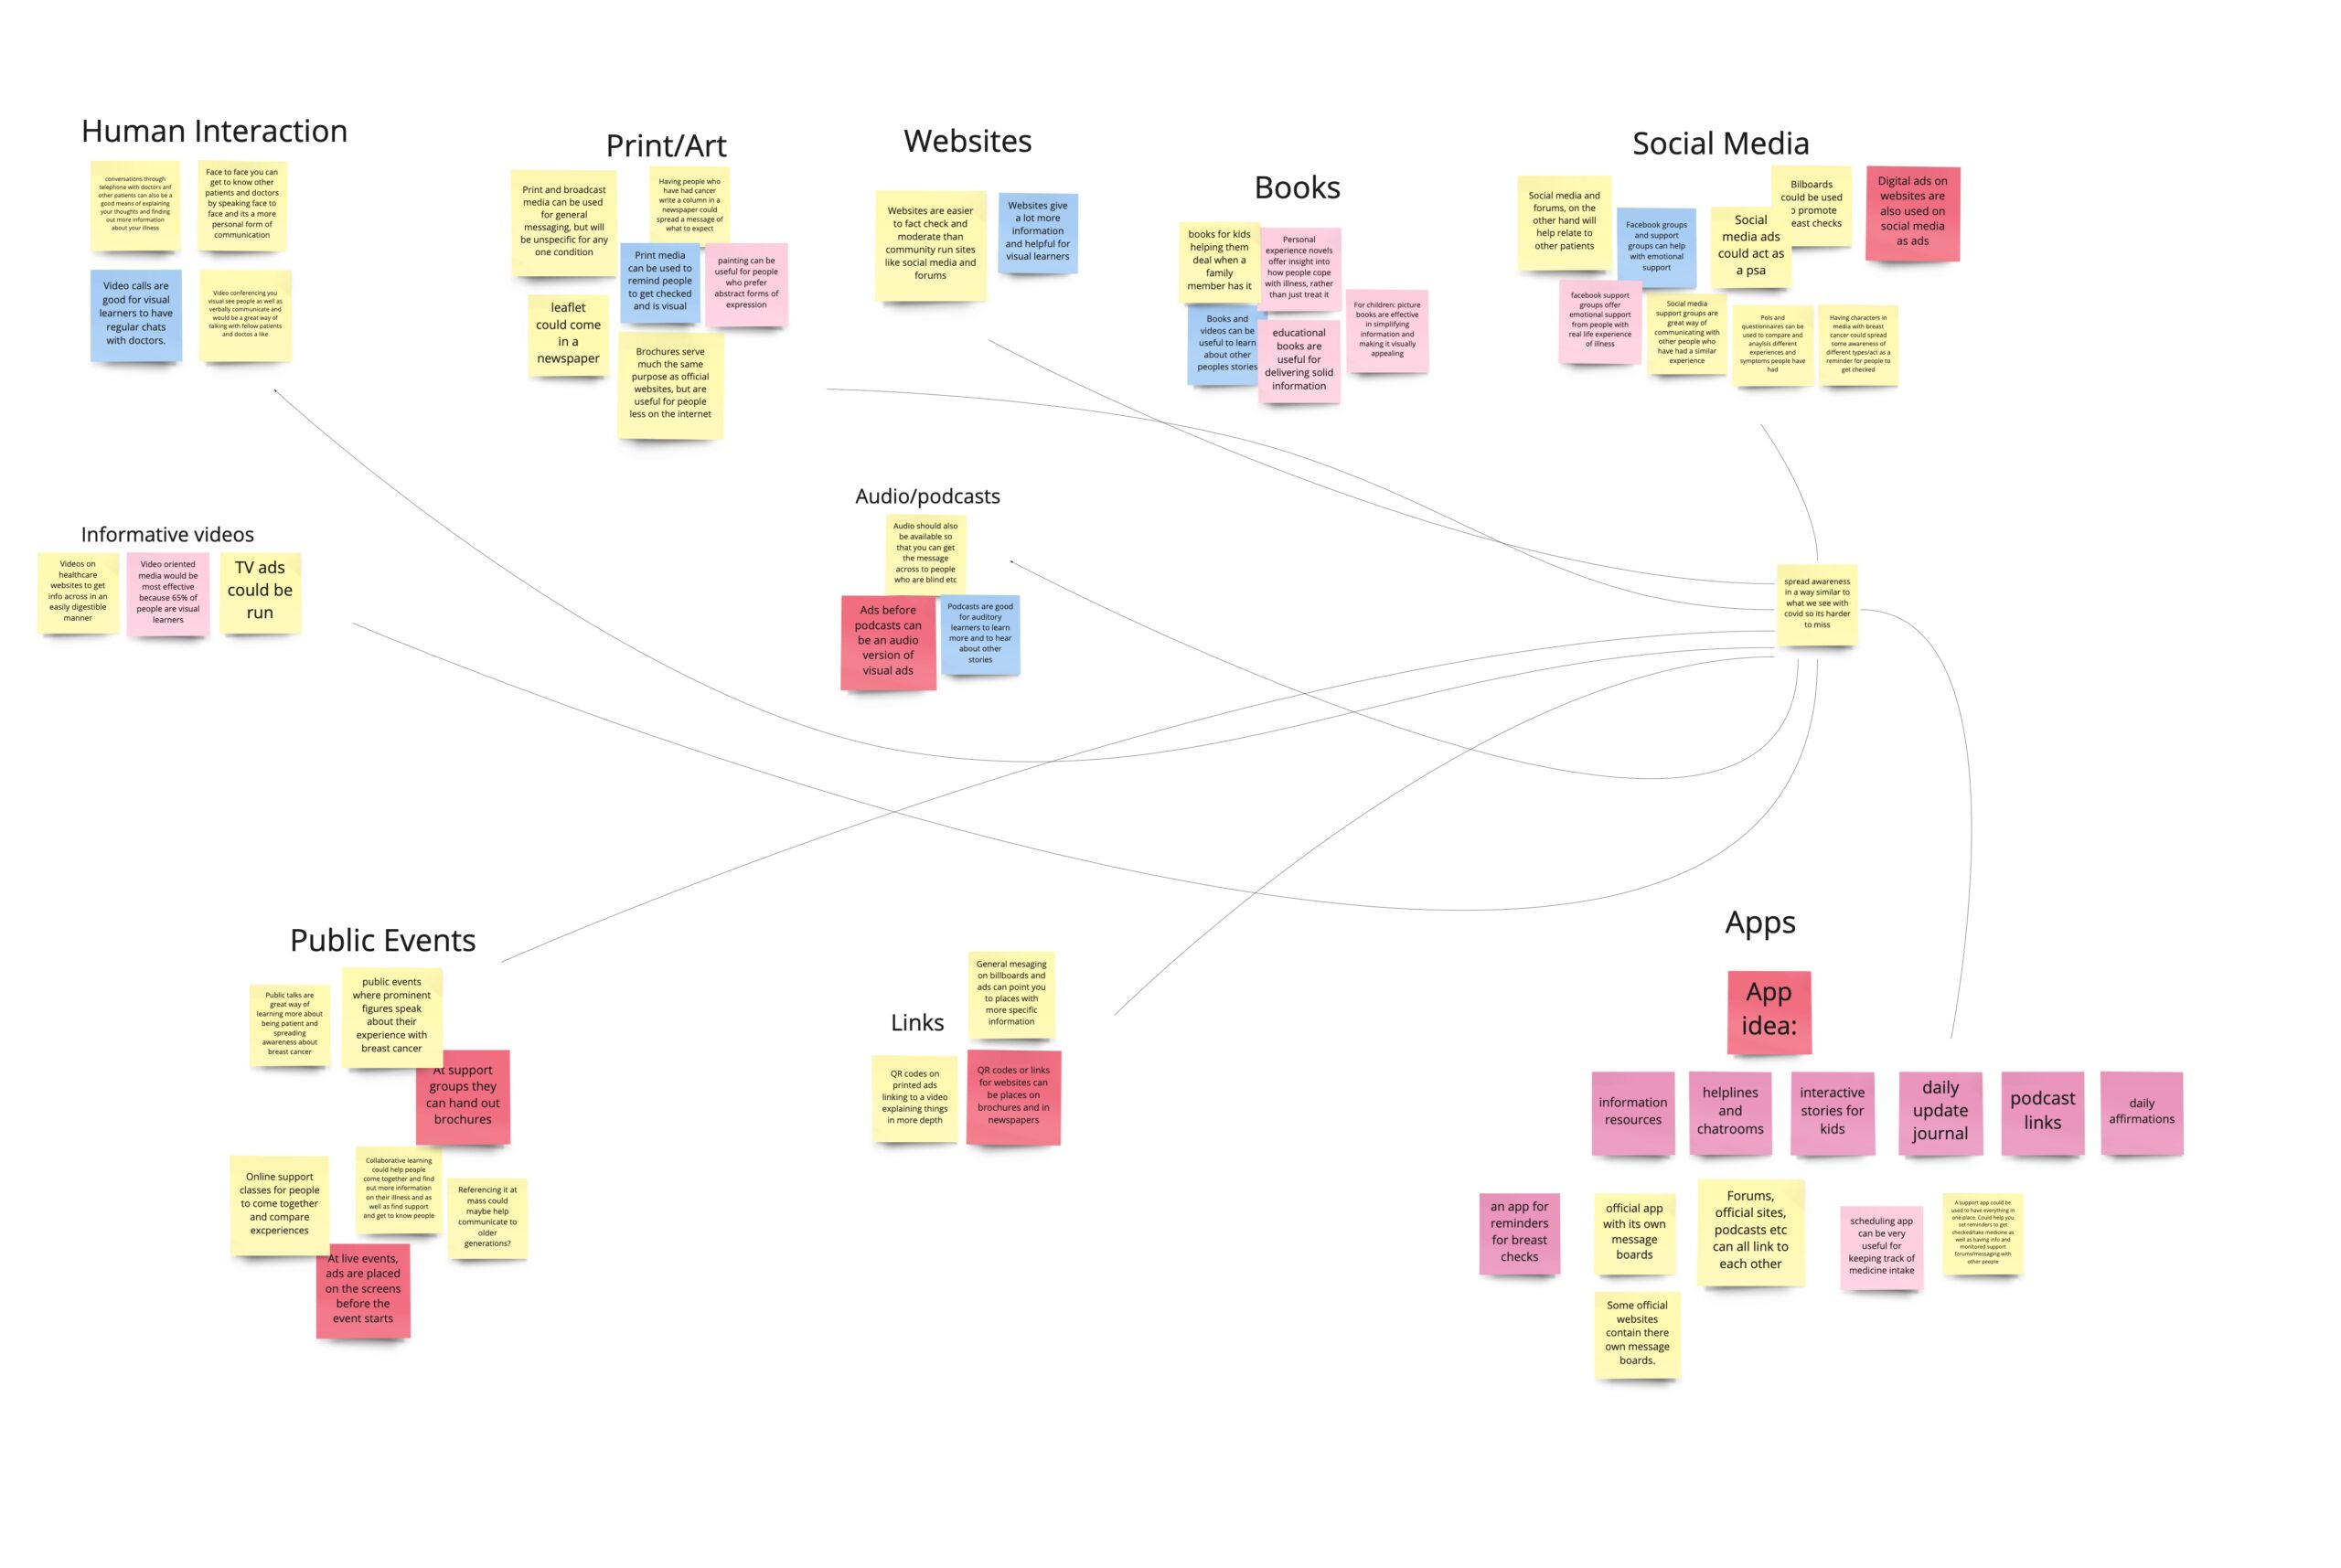
After completing the lists the teams used their findings to ideate ways to use media and communicate channels to connect with patients, their ideas were then clustered and given titles.
Pathways began to emerge with some ideas around cross channel connections. The pathways were good points of reference for future communication campaign ideation session.
Communication Timeline
Brief
Referring to what we have learned look at the different phases of the timeline and ask yourself:
- What ways could you communicate with someone about their diagnosis?
- What touch points are best for signposting patients?
Add post it notes, you can duplicate if you feel something is appropriate for a number of stages.
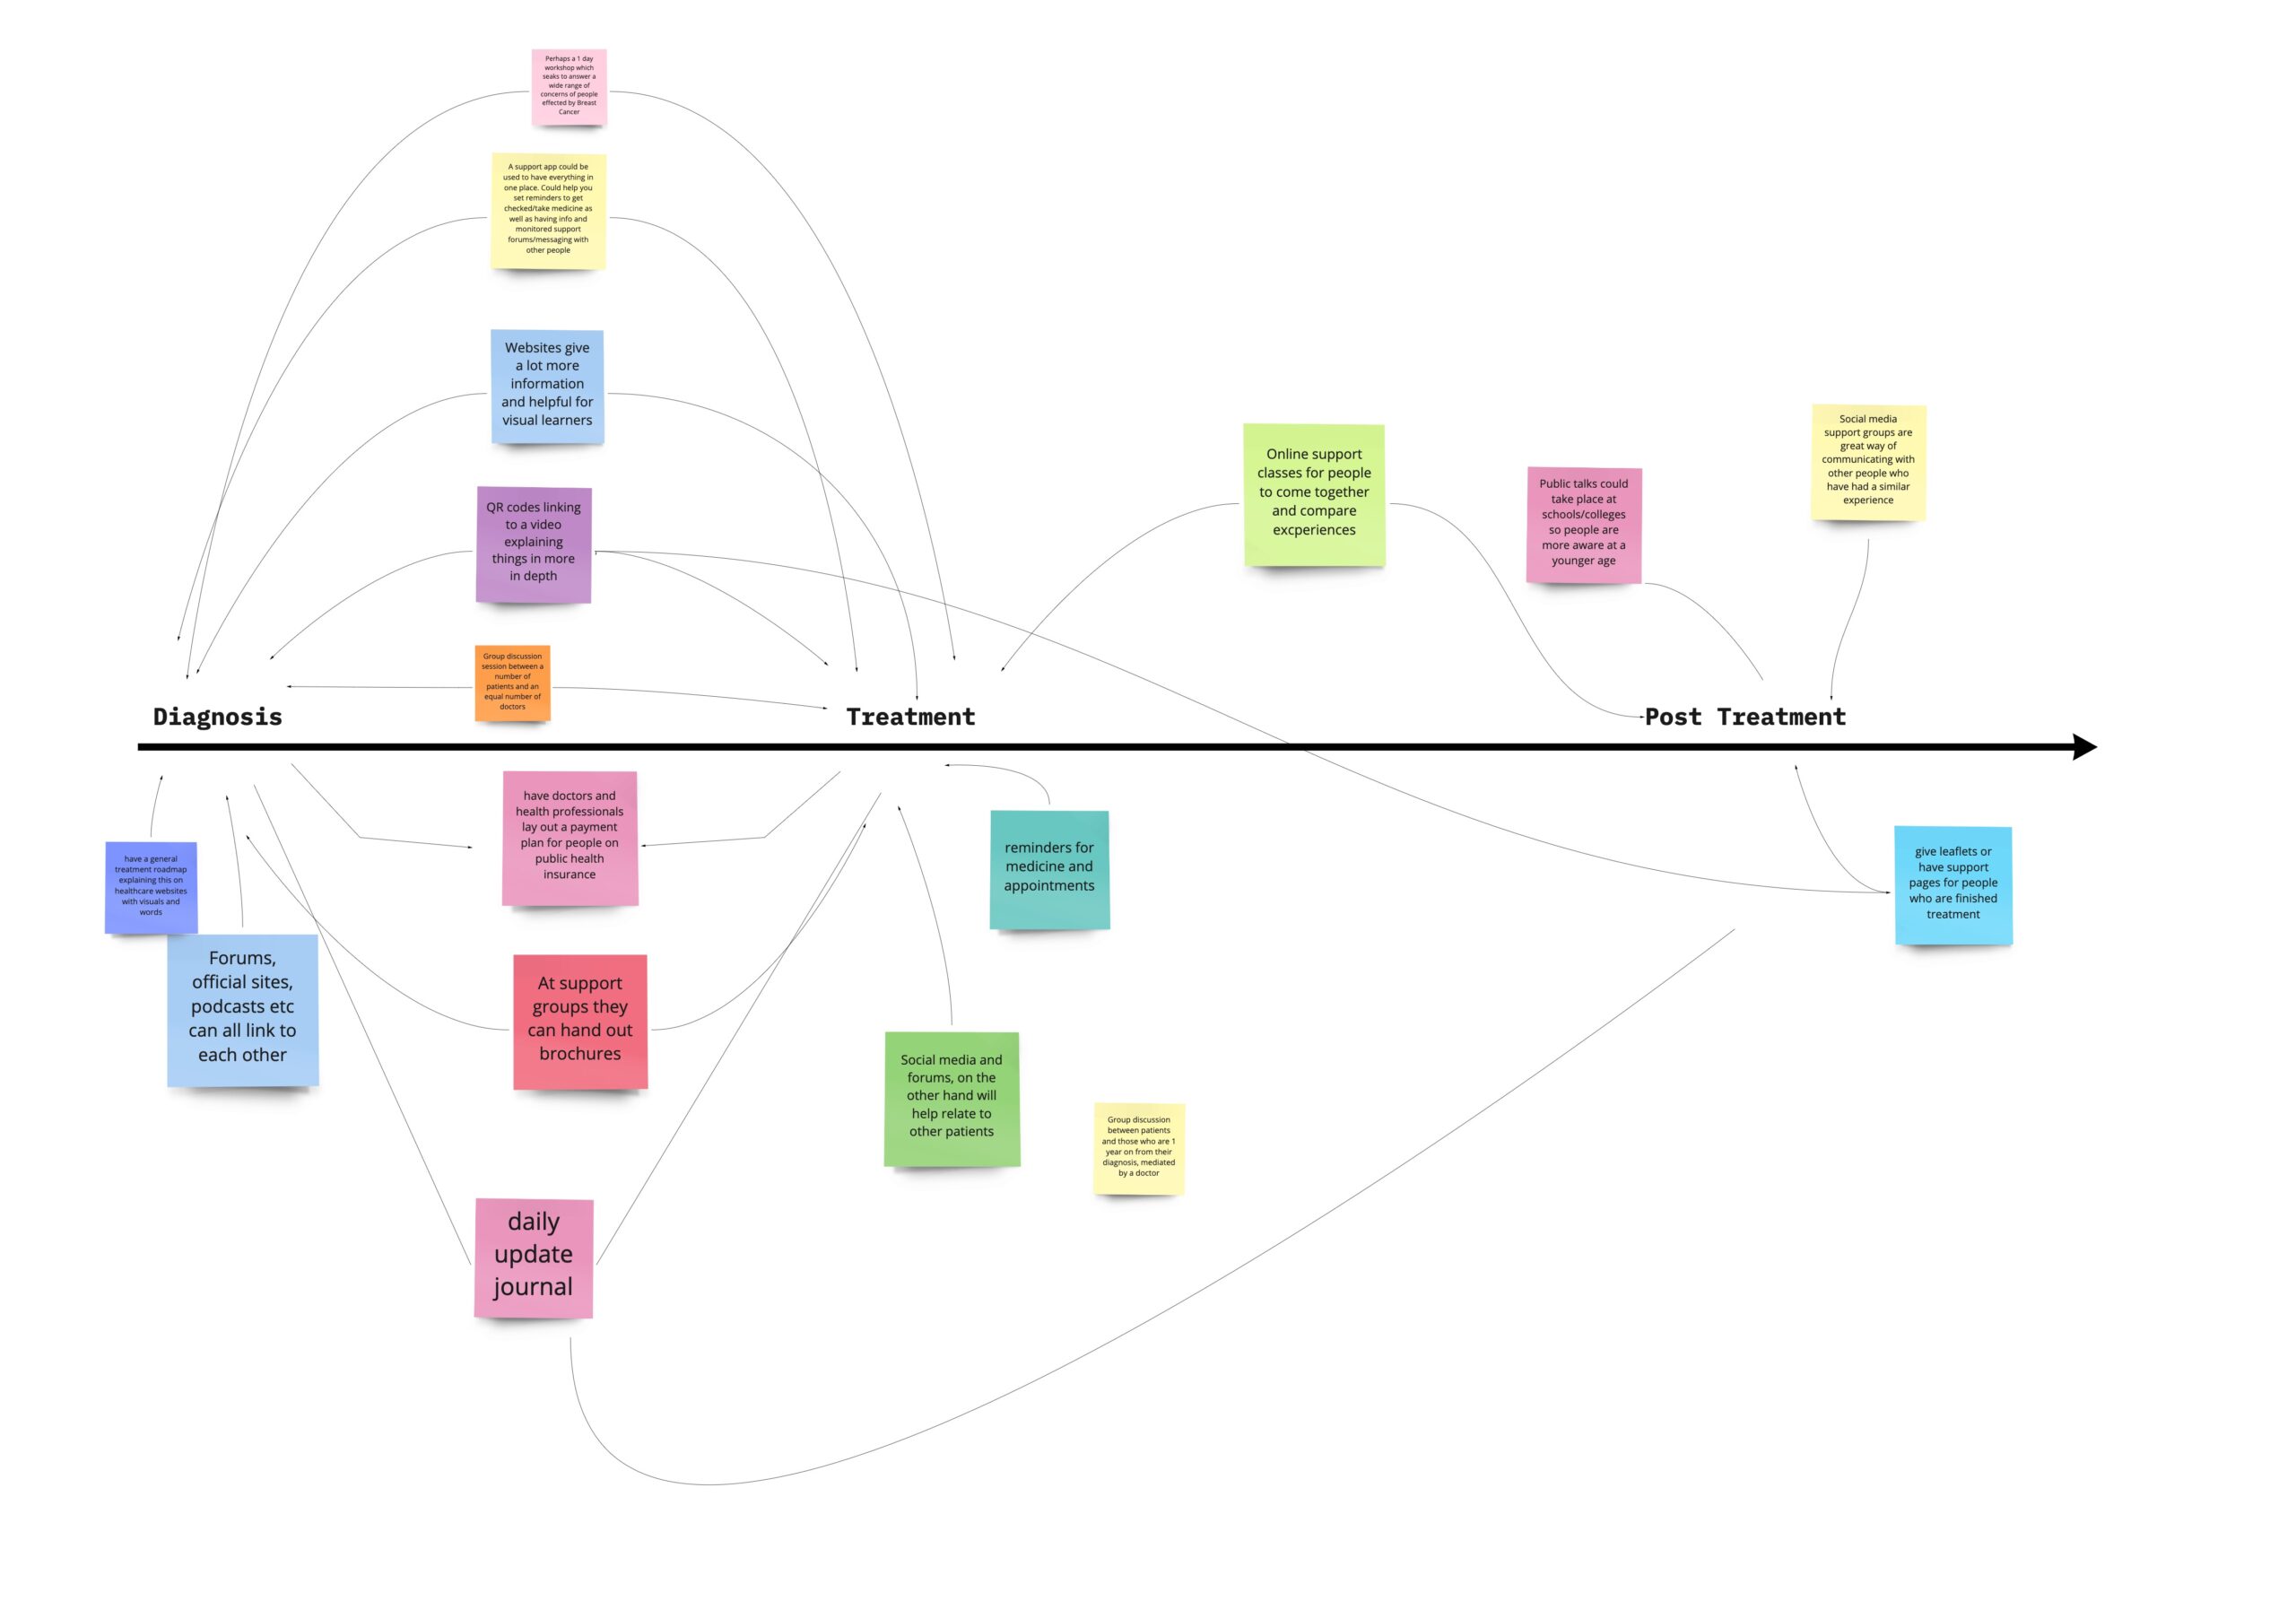
Timeline Insights
Insights
It is not surprising that the step from diagnosis to treatment is reflected by the largest cluster of post-it notes on the timeline. This visual also reflects the steep learning curve from diagnosis to treatment.
Further Research:
- Does the patient need for information lessen over time?
- Is it a case that patients choose the channels that work for them and stick with those?
- Do they change their choices as time moves forward?
- What works/does not work for them at each stage?
Research Charette Report
After the research charette I compiled a full design report of the research findings. The insights informed my masters project proposal and the research I performed for my MA Design for Change @IADT Thesis.
